Understanding the growth of financial indices
- blog de anegrete
- 3584 lecturas
Humanity is facing the worst economic crisis on record since 1872 while major financial indices are at all-time highs. Is the real economy devalued from the financial markets? What does this mean?
A financial index refers to the stock market's general state, usually constructed by weighting changes in stock prices. Among the most famous indexes are the Dow Jones, which lists the 30 largest capitalized companies in the US and the S&P500, a key indicator for many years, considering the 500 most relevant companies listed on the US stock market and reflecting the market situation. It usually reflects expected company earnings.
However, because of how this index is constructed, it is sensitive to the high corporate capitalisation concentration. Currently, Apple, Facebook, Amazon, Microsoft, and Alphabet (Google) represent almost a quarter of the stock market capitalization value. They account for a large part of the index's growth.
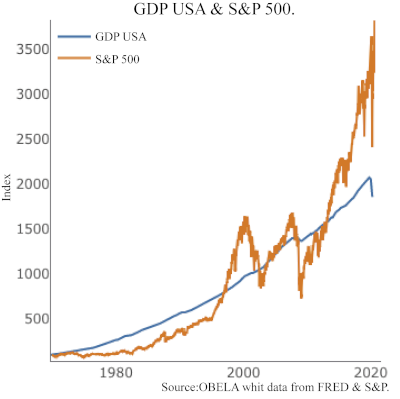
When observing the relationship between the S&P 500 and the US GDP, it is evident how the growth of the index exceeded the development of the product and the adjustments that took place during the dotcom crisis (2000) and the financial crisis of 2008.
A more detailed look at the stock market shows the expectations in specific sectors and the changes in the economic and productive structure. It is evident when taking into account the constituent parts of the S&P 500 by industry.

The index as a whole shows a growth of 13% per year during the same period in which Apple doubled its market value, becoming the company with the largest capitalization in history, exceeding two trillion dollars (South Corea’s GDP in PPP).
The information technology industry achieved an advance of 40% so far this year, significantly the internet's component has increased by 42%. In contrast, the banking industry, experienced a 32% contraction in their share value, where banks face increases in non-performing loans and profit reductions. However, it differs from the shares of those operating in the capital markets, that have found almost no price variation in price.
The industrial sector presents a variation close to -6%, contrary to the retail sales industry and food and drinks consumption, where a 14% increase happened. Similarly, in the face of restrictions on tourism and the closure of work centres, the transport sector faces a slight loss of -4%, compensated by the courier companies. Still, the aerospace sector is facing a reduction of -20%.
The most dramatic fall occurred in the energy sector with a loss of -45 %, an effect expected after observing a negative price on oil futures contracts in April. The oil and gas exploration and extraction companies lost -52% of their share price and dragged down the industry that produces machinery and services for oil extraction, which expressed a loss of more than 60%.
Exxon, which entered the index in 1928 and was the oil company with the largest capitalization in 2013, left the Dow Jones index within these movements. It shows the loss of relevance of oil as the most critical energy input and its future. At the same time, clean energy companies increased their share price by 43%.
After the March crash and the Federal Reserve's bailout, there is excess liquidity in the market, which the significant investment funds placed where it pays off positively. It results in a high concentration of market capitalization that drives the index, providing the appearance of a boom. The increase in the index does not reflect the dynamics of the economy as a whole. Technology and the internet lead the index growth, while the change in the energy matrix and the expected transition in energy consumption and production are addressed.